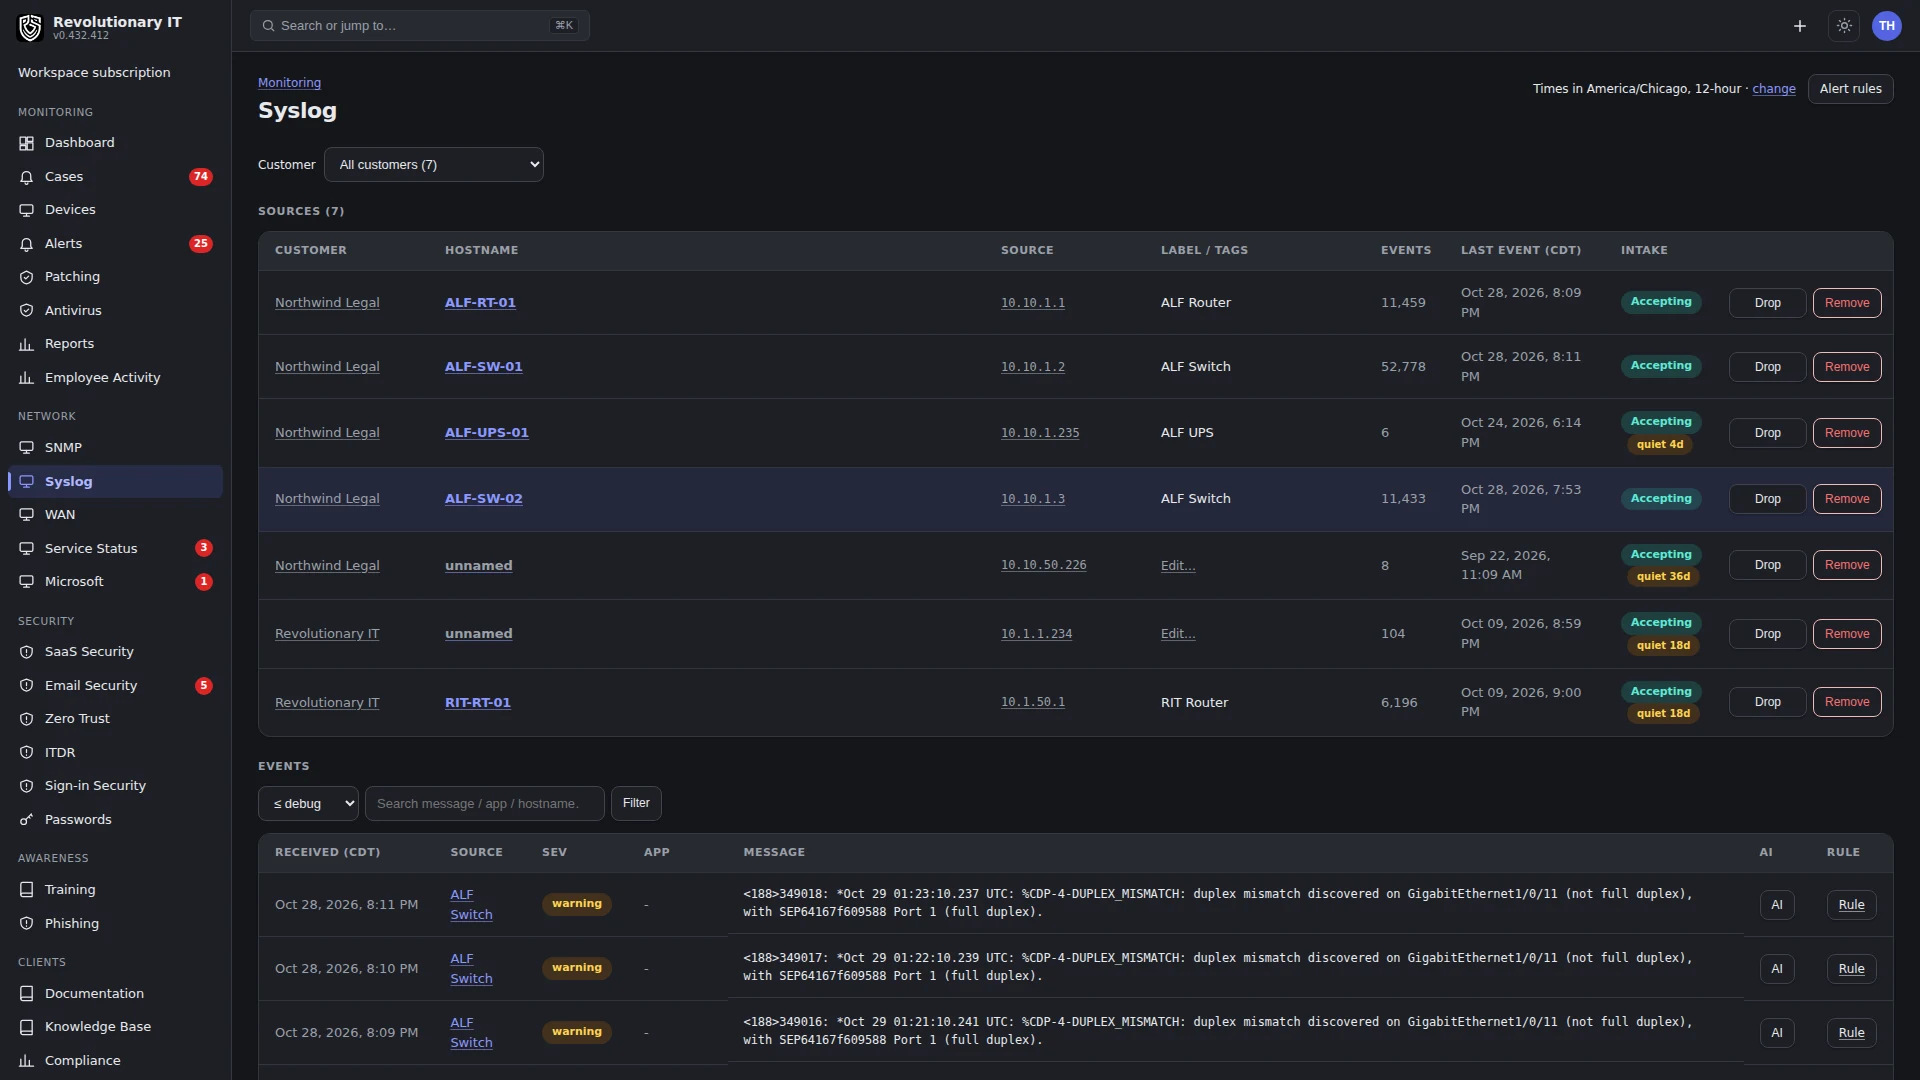
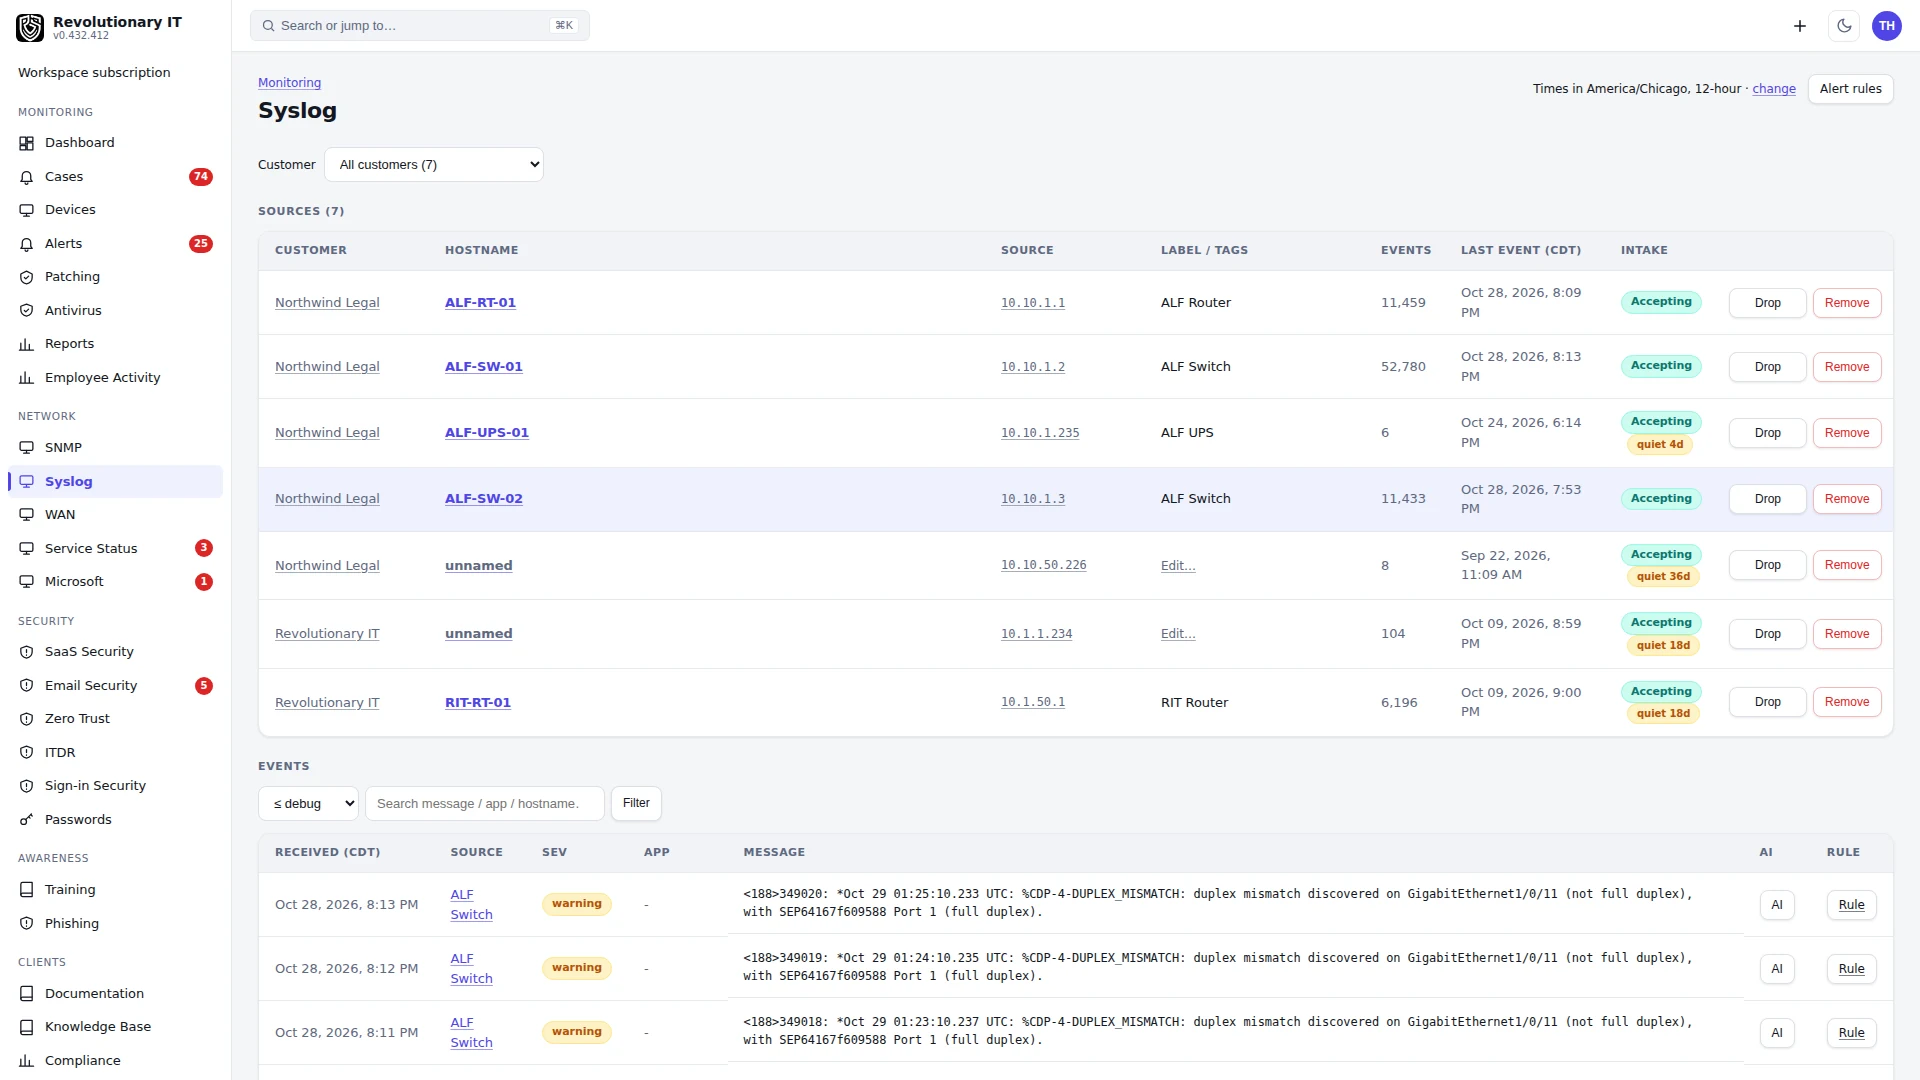
Syslog
Video guide: Find syslog events and collection prerequisites
Recorded October 22, 2026 in the fictional Summit Managed IT staging workspace, App 0.432.1. The deployed demo can differ from the current product; use the written guide for current behavior. Empty event list and filter preparation; no collector setup, incoming test packet or alert rule execution.
Full narration captions are included in the video. Open video full screen · Download subtitles · Download transcript
Video transcript
Open Network, Syslog. This demo has no events. An empty list can mean no traffic, missing forwarding or a collection problem; it does not prove that the environment is healthy. Confirm the intended customer, collector and sender before diagnosing the content.
Inspect the available severity and message filters. Use a recognizable test message from an authorized sender when checking a real installation. Record the send time and compare the received event time and source rather than relying on a service-is-running indicator.
After a test event appears, check its fields, retention and intended alert rule. Any Ask AI response is optional advice, not proof that the collector received the original packet or that a response action ran. This walkthrough demonstrates navigation and inspection only.
What it does
Syslog collection receives device logs (firewalls, switches, access points, UniFi CEF, Linux hosts) at each site, normalizes them, keeps a short local window, shows a per-source feed with severity and hostname, raises alerts from rules, and lets a technician ask the AI what an event means and how to fix it.
How it works
- The same relay device that polls SNMP also listens for syslog (RFC 3164 and 5424 over UDP 514 by default) and forwards events to the workspace. Sources are keyed by the sender's IP as it appears in the message; a source can be enabled or disabled (disabled sources are dropped at ingest), labeled, given a friendly hostname and tags, and assigned to a location.
- Classification starts with the PRI severity. Valid CEF messages supply their own severity and event identifiers. For plain messages or unparsed CEF, keyword rules can promote severity (for example, an error or authentication failure); they never reduce the severity reported by PRI. The original PRI severity is retained separately.
- Rules: Administration > General > Alert Rules > Syslog. A rule matches facility, severity floor, program or message pattern for chosen organizations and opens an alert of a chosen severity per matching event (syslog alerts are event based and do not self-resolve).
- Retention: events older than the retention days (default 7) are purged nightly. Long-term retention belongs in an external collector; the point of the local window is triage.
- Health: the sources table shows Accepting or Dropping, a quiet pill when a source has been silent for a day, and the last event column, so a device that stopped logging is visible.
Step by step: set up
- Org page > Credentials & API > SNMP monitoring > Relays: designate the relay if not already done for SNMP.
- On each network device, set the syslog server to the relay's LAN IP, UDP 514, and the level you want (informational is noisy; notice or warning is a good start).
- Network > Syslog: the source appears on the first message. Press Edit to set its hostname, label, tags and location, or disable it.
- Optional: Administration > General > Alert Rules > add a syslog rule for the events that should page (for example severity 0 to 3 from firewalls).
- Events are kept for 7 days; this window cannot currently be changed in the app.
Day to day
- The dashboard feed shows the newest events across all sources with hostname, source, severity, program and message; the source page shows one device's events with filters.
- Ask AI on an event opens a modal that explains the event with the preceding events from the same sender as context, and takes follow-up questions.
- UniFi: the gateway sources syslog from the interface facing the collector, so its syslog IP may differ from its SNMP IP; that is expected.
Collection limits
The default listener uses UDP on the site network. UDP delivery is not acknowledged, and this local retention window is not a durable compliance archive. Use an external collector when your retention or delivery requirements exceed this triage feed.
Verification
- A test message (
logger -n <relay ip> -P 514 test) from a Linux host appears in the feed within seconds.
Troubleshooting
- Nothing arrives: the relay device is offline, UDP 514 is blocked between the device and the relay, or the source is disabled.
- Unexpected severity for UniFi: check whether the message was parsed as valid CEF. Otherwise, classification uses PRI plus raise-only keyword rules; plain text does not always keep its PRI severity.