

Monitoring and alerts
Endpoint monitoring and alerts
Know what needs you. Ignore what does not. Revolutionary RMM watches Windows, macOS and Linux endpoints for MSPs, applies each customer's own thresholds, and keeps an alert open only while the problem is still true.
Inside Revolutionary RMMAlert detail
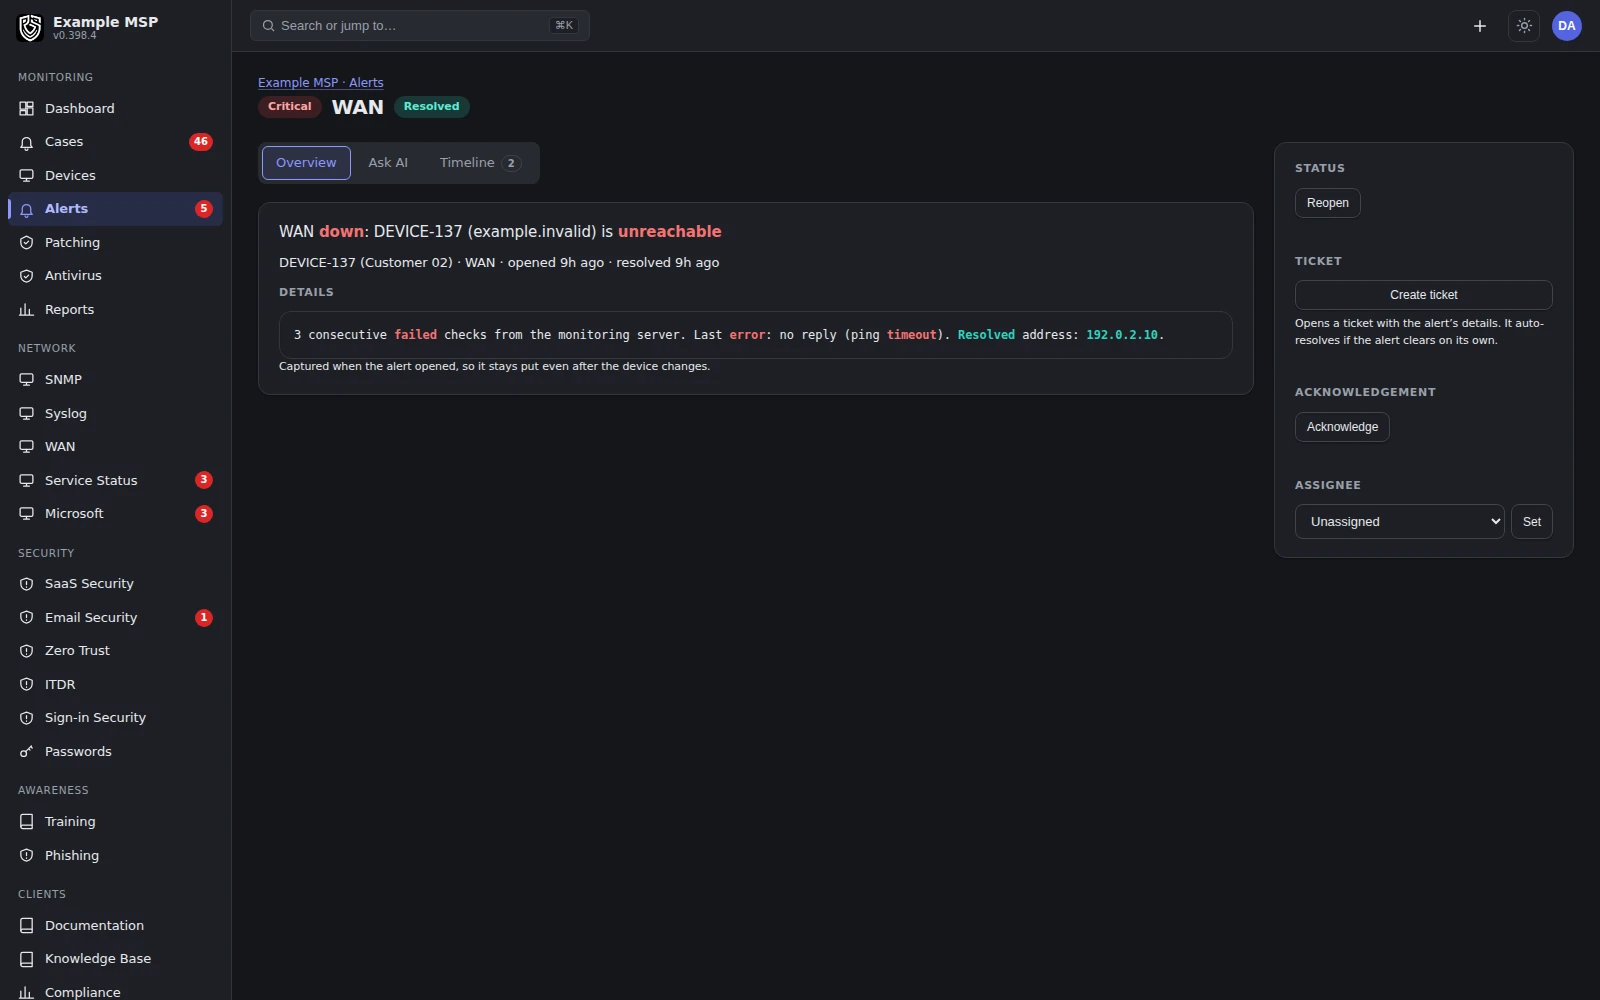
One alert with the device, its customer and the next step in the same view. Product capture with fictional customer names.
What it watches
The signals that should page someone.
The agent checks in every 60 seconds. Each reading below can drive an alert, a ticket or an automation.
01
Performance
Processor and memory, charted per device, so a slow machine has history behind the complaint.
02
Disk space
Free space per volume, with thresholds you set per customer instead of one global number.
03
Antivirus state
Microsoft Defender and third-party engines: running or not, definitions current or not, active threats.
04
Patch state
Missing security and important updates, and whether the machine is waiting on a reboot.
05
Encryption
BitLocker status per volume, including drives that are encrypted but left unprotected.
06
Unexpected reboots
Boot times are compared, so a crash restart raises an alert while your own patch reboots stay quiet.
07
Network adapters
Throughput per adapter from the operating system counters, with self-assigned addresses filtered out.
08
Who is on the machine
Last signed-in user, session activity and uptime, on Windows, macOS and Linux.
09
Services and scripts
Watch a named service, or let a script decide, with a non-zero exit meaning failure.
Inside Revolutionary RMMDevice overview
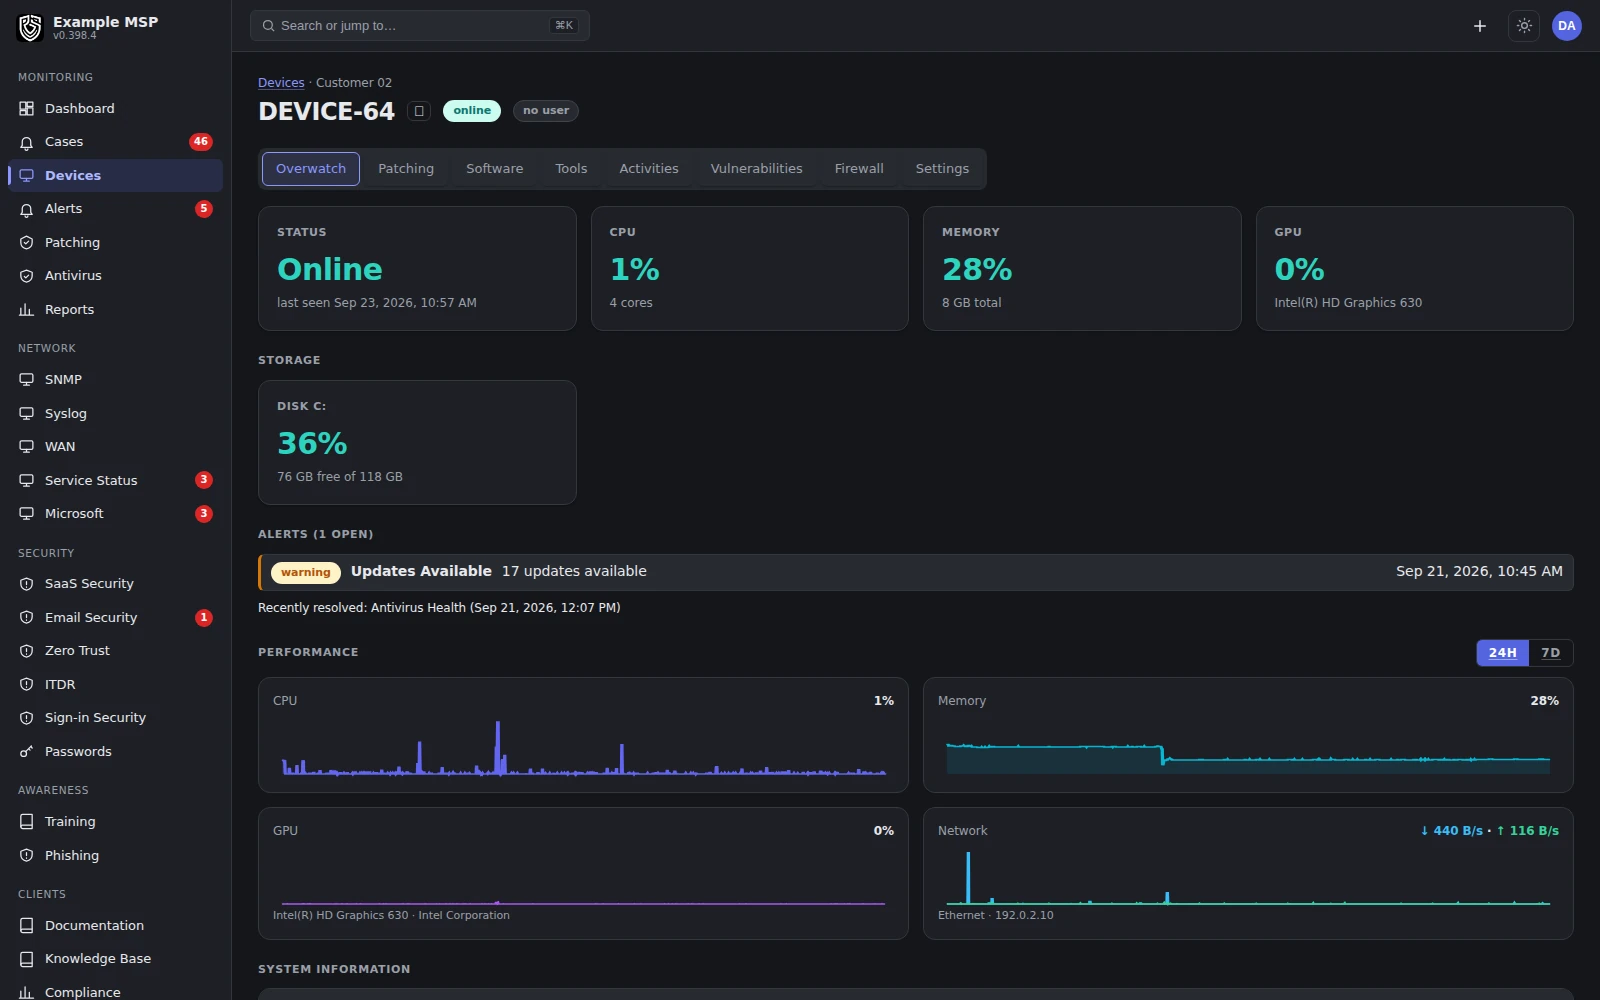
One device with its status, storage, open alerts and performance history on a single tab. Product capture with fictional customer names.
How it works
From a reading to a closed problem.
Policies decide what counts as a problem. Alerts track the condition. Cases hold the work.
01
1. A policy sets the threshold
A policy applies to an organization, narrows at a location or device group, and can be pinned to one device. The most specific layer wins, so a noisy server gets its own numbers without loosening the rule for everyone else.
02
2. A trigger fires an alert
Each trigger has its own name, severity and reset interval. A processor trigger can require a sustained period, so a single spike from a build job does not wake anyone.
03
3. The alert stays honest
When the disk frees up or the service comes back, the alert resolves itself and says so. Repeats fold into the open alert, and a storm arrives as one digest.
04
4. A case holds the work
Alerts on the same device roll into one case with an owner and a state. Tickets, logged time, remote sessions, notes with pasted screenshots and file attachments all live on the case.
05
5. The close is on the record
A case records how it closed: the condition cleared on its own, a technician closed it by hand, or an operator asserted it was fixed while the condition was still open. A script that exits zero is not treated as proof.
Inside Revolutionary RMMCases
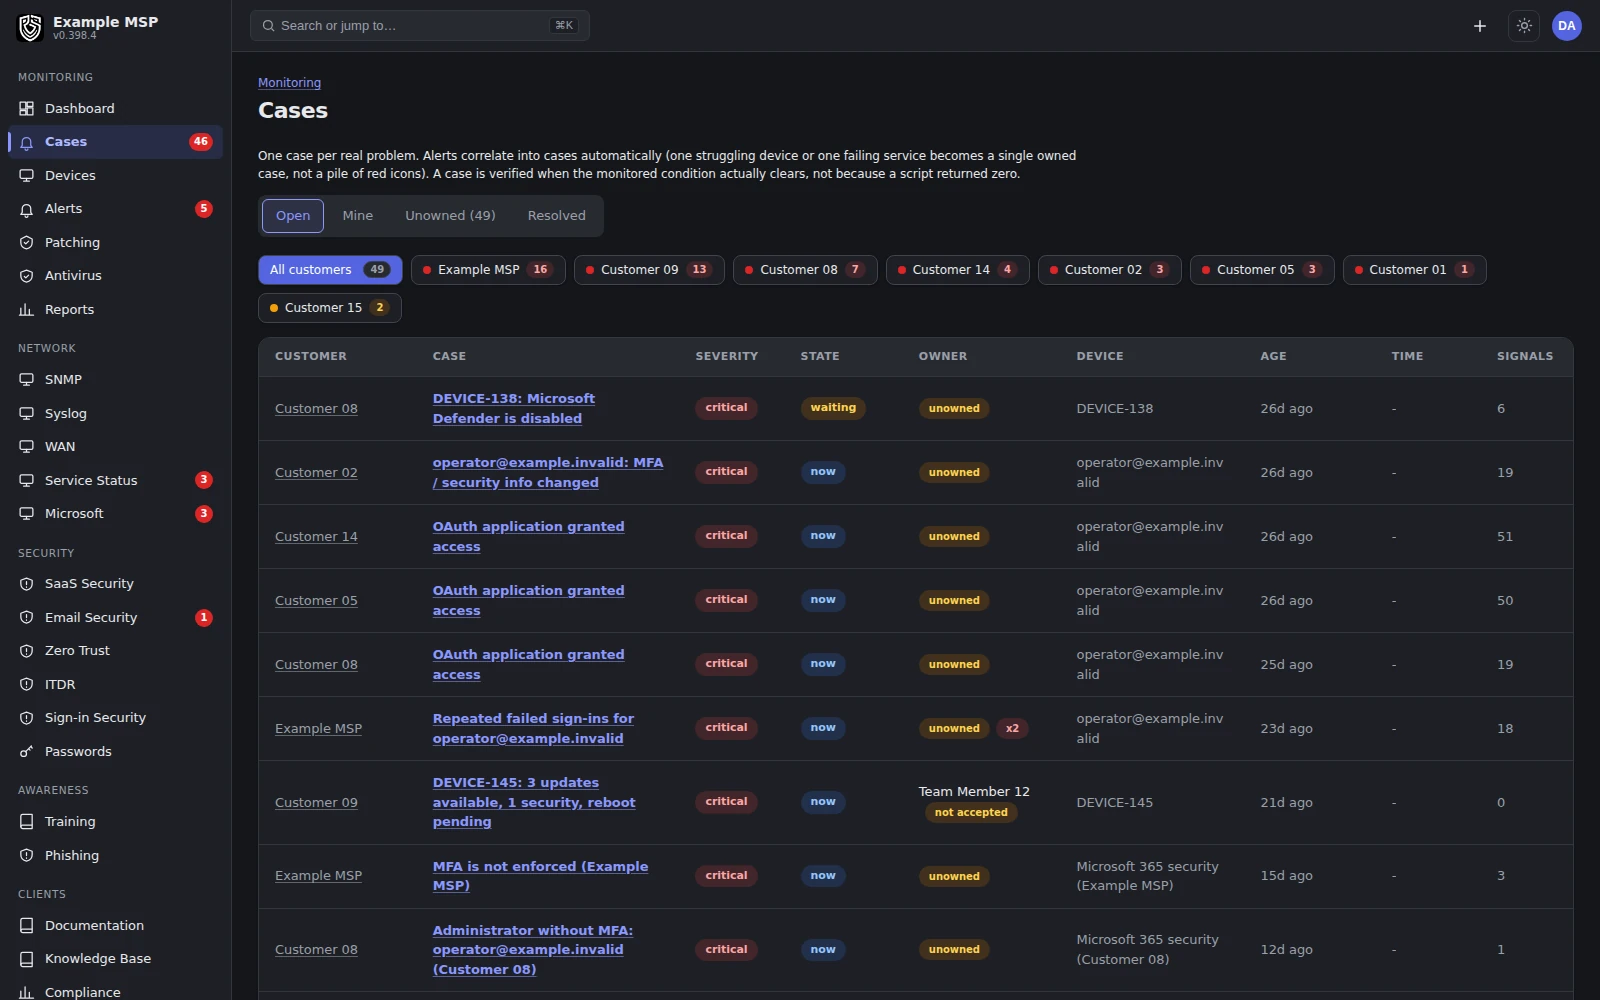
Open cases grouped by customer, each with its severity, state and device. Product capture with fictional customer names.
The detail
Tuning, tickets and follow-up.
Policy
Layers and groups
Organization, location, group and device layers resolve in that order. Dynamic device groups match on client, location, operating system and tags.
Quiet
Maintenance and flapping
Maintenance windows suppress alerts during planned work, snooze silences one alert, and flap suppression holds back a signal that keeps bouncing.
Work
Alert to ticket
Turn any alert into a ticket in one click, or let an alert source open one on its own. If the condition clears, the ticket resolves with it.
Care
Watch a system
Flag a device that needs extra attention, and its alerts bypass the severity floors on your notification subscriptions.
Action
Automations on a trigger
Attach an automation to a trigger and it runs when the trigger fires.
Assist
Investigate with AI
Ask for a read on an alert and the answer draws on the device metrics, recent commands and matching log lines. It uses your workspace's own AI key.
Limits
What it does not do yet.
Limits
- The agent does not report a load average. Processor and memory are charted per device; load readings come from SNMP network devices only.
- There is no network discovery scan yet. Devices appear when an agent is installed, when SNMP polling is set up, or when you add them by hand.
- AI investigation suggests. It never runs a command or closes an alert on its own, and it needs your workspace's own AI key.
- The agent needs Windows 10 or 11, or Windows Server 2016 and later. Older Windows versions cannot run it.
Not in the product today: one connected asset record across agent, network, mobile and manual sources, and network discovery per location.
Questions
Good to know.
The agent checks in every 60 seconds. A device that stops checking in is shown as offline within a few minutes, so a machine that drops off is visible quickly instead of at the next scan.
Not if you tell it. Maintenance windows suppress alerts during planned work, snooze silences a specific alert, and flap suppression holds back a signal that keeps bouncing.
Yes. Policies attach to an organization and can be narrowed by location, device group or a single pinned device, so one customer's busy application server does not set the standard for everyone else.
They can. Any alert can become a ticket in one click, and alert sources can be set to open one on their own. When the condition clears, the ticket resolves with it.
No. A zero exit code is not proof of recovery. A case closes when the condition clears on its own, when a technician closes it by hand, or when an operator records that it is fixed, and the case shows which one happened.
Keep exploring
Limits, checked daily
Not in the product today.
Each line below is a gap recorded against this capability in the product's own feature record. A line leaves this page by itself on the next daily run once that record says the gap is closed, so the list cannot fall behind what we ship. The rest of this page is written by hand.
- Alerts compare a reading with a threshold you set, so a value that is merely unusual for that device is not flagged on its own.
- There is no single reliability score per device that gathers crashes, hangs and application faults into one number.
- Device filters live in the page address and can be shared as a link, but they cannot be saved by name and two devices cannot be put side by side.
- A Windows event log entry cannot be watched as its own check, with a pattern and a count over a number of days.
- Device performance readings are kept for about a week, so a chart shows recent behavior rather than a trend across months.
Next step
See it on your own devices.
Half an hour on a call. Bring the alert your team is tired of seeing and we will show you how it would be handled.
