WAN monitoring and cloud service status
Video guide: Inspect WAN and cloud-status evidence
Recorded October 22, 2026 in the fictional Summit Managed IT staging workspace, App 0.432.1. The deployed demo can differ from the current product; use the written guide for current behavior. No new monitor, network outage injection, alert delivery or provider availability certification.
Full narration captions are included in the video. Open video full screen · Download subtitles · Download transcript
Video transcript
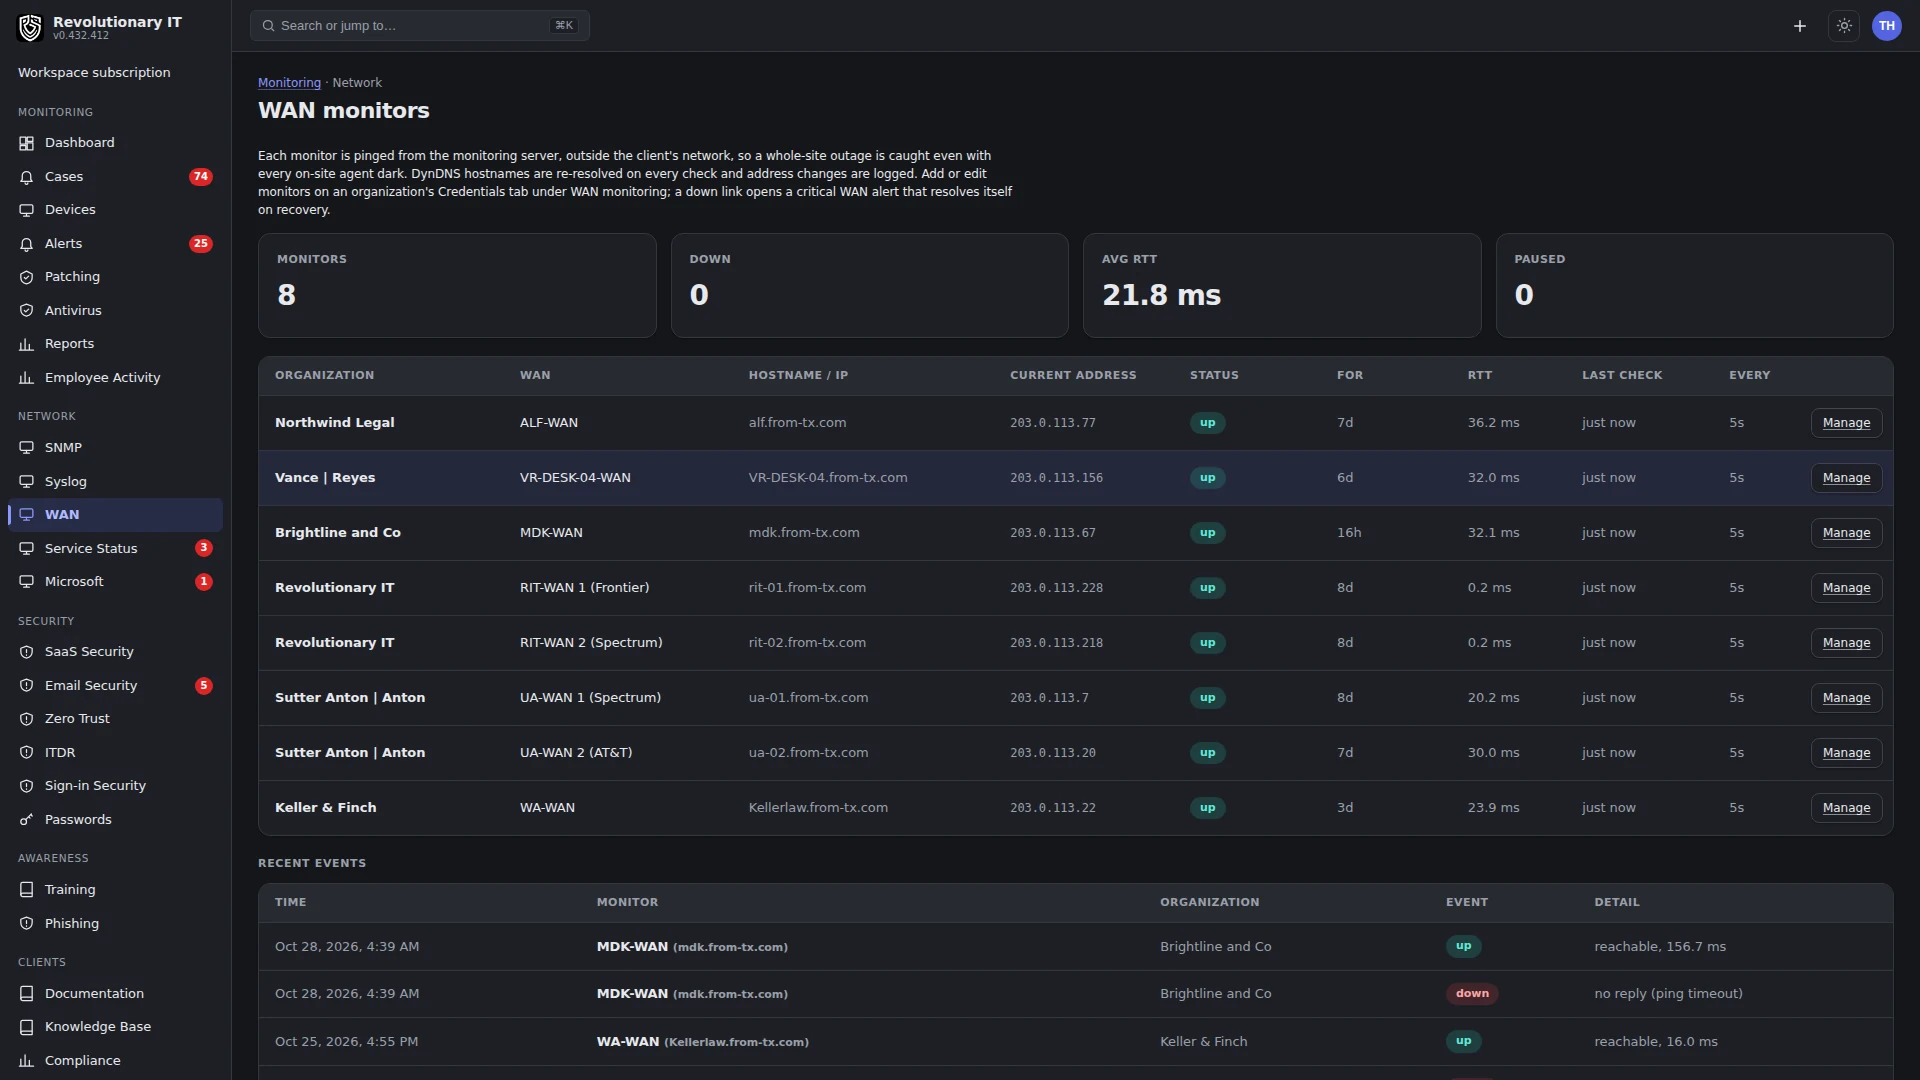
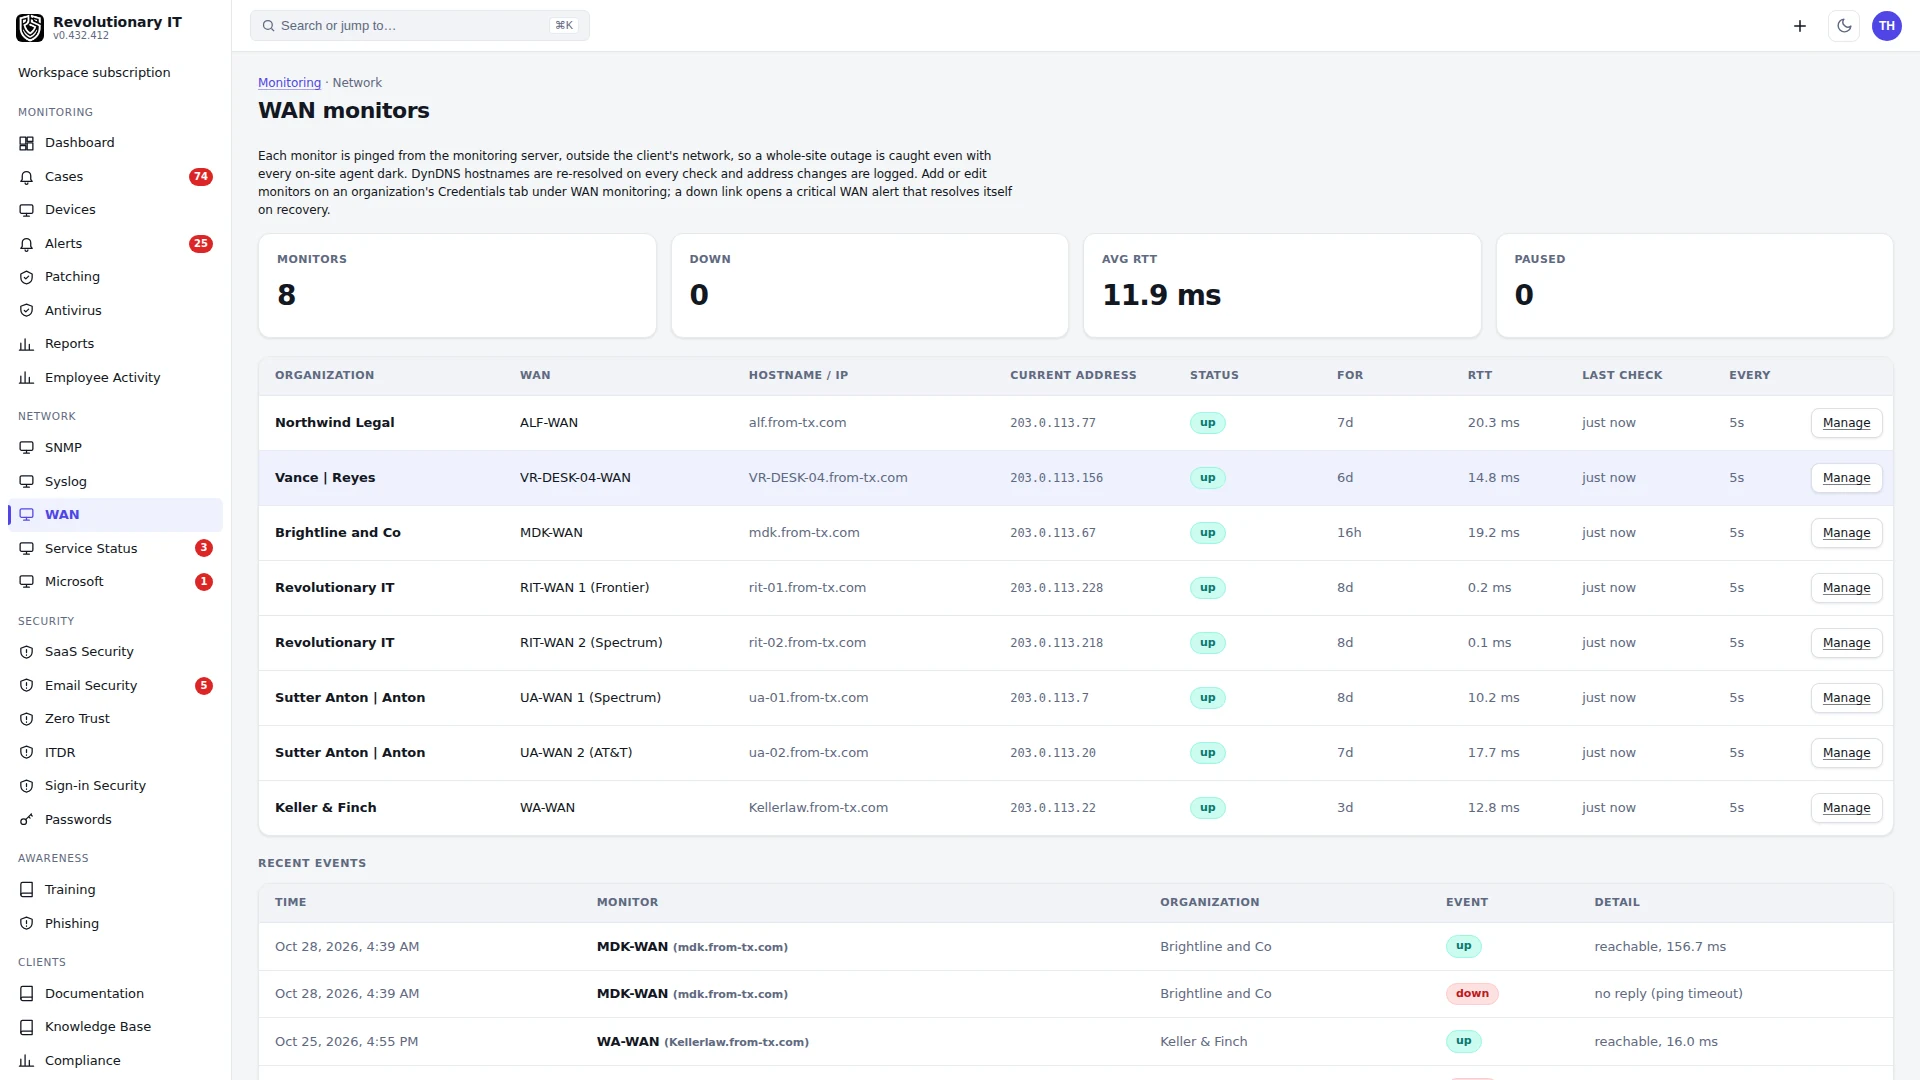
Open Network, WAN. An external reachability check observes a particular target from a particular location. It does not establish that every application or every user connection is healthy. Check the target, customer and observation time.
Open Service Status for cloud providers. Vendor status and a customer WAN check describe different evidence sources. A provider reporting healthy does not prove the customer can sign in or reach an application, and a failed ping is not a complete root-cause diagnosis.
Follow the guide to configure authorized targets and alert rules. Verify a known test observation, its timestamp and intended customer routing. Compare vendor and local evidence during an incident and retain uncertainty when one source cannot explain the user symptom.
WAN monitoring
What it does: pings a customer's public address (a static IP or a DynDNS hostname) from the app server every few seconds to minutes, so a site outage or a WAN IP change is detected even when the customer's LAN has no agent that can report it.
How it works: each monitor resolves its hostname on every check (the resolved-address trail is the DynDNS history), pings with one retry, marks the link down after three consecutive failures and opens a CRITICAL WAN alert, and resolves the alert when the link recovers. Intervals from 5 seconds to an hour; monitors under 60 seconds are looped inside the minute tick with a budget. The wan-check timer runs every minute.
Steps:
- Org page > Credentials & API > WAN monitoring > Add: name, DynDNS hostname or IP, check interval (5 to 3600 seconds), and optionally a certificate port (443 for a web site or firewall page) with the number of days of warning before the certificate expires (1 to 180).
- With a certificate port set, the TLS certificate the site serves is read every six hours and judged for expiry, name and trust: an expired, untrusted or wrongly named certificate is critical, one expiring inside the warning window is a warning (critical at seven days), and the alert clears when a healthy certificate is served. Edit lets you clear the trust alert for a firewall page that uses its own certificate; expiry still alerts.
- Network > WAN shows one flat table (organization, WAN, hostname or IP, current address, status, certificate, how long, RTT, last check, interval) sorted down-first, with Monitors, Down, Avg RTT, Certificate issues and Paused counts above and the event feed (down, up, address change) below.
Notes: a hostname with several A records logs round-robin address changes; real WAN hostnames have one record.
Cloud service status
What it does: watches the status pages of the cloud providers the MSP cares about (Microsoft 365, Azure, AWS and Google Cloud, plus any custom Statuspage or RSS feed), shows incidents, scheduled maintenance and IT security news, and, when Provider incident is turned on in Alert Rules (it is off by default), opens CLOUD alerts for major and critical incidents. Per-customer Microsoft 365 service health (tenant incidents) is on Network > Microsoft.
How it works: the cloud-status timer polls every provider every 5 minutes, stores incidents with their components and reconciles alerts with the provider feed. Check the provider's linked status page when making an operational decision; this view depends on that feed and its last successful refresh. The regional view shows configured AWS, Azure and Google Cloud regions. Security and IT feeds provide news. CLOUD alerts do not open cases by default; Alert Rules can override that behavior.
Steps:
- Network > Service Status > Settings (top right): tick the services to watch and the countries whose regions matter; unticked ones are neither polled nor shown.
- Custom providers: add a Statuspage URL or an RSS feed with a name.
- Alert impact: minor incidents show on the page but do not alert; major and critical do.
Verification: after the first tick, the page shows each ticked provider with its current state; a provider incident shows on the page with a link to the provider's page. It opens a CLOUD alert only when Provider incident is turned on in Alert Rules (it is off by default).
Troubleshooting: an empty Microsoft 365 tenant health section does not identify a single cause. There may be no stored incidents, collection may have failed or not run yet, or consent may be missing. Check the connection, consent and refresh state, then compare with Microsoft's tenant health view. ServiceHealth.Read.All is the permission used for service incidents; ServiceMessage.Read.All covers Message Center posts. An empty view alone proves neither missing consent nor healthy service.