Devices and the device page
Video guide: Find a device and inspect reporting evidence
Recorded October 22, 2026 in the fictional Summit Managed IT staging workspace, App 0.432.1. The deployed demo can differ from the current product; use the written guide for current behavior. Fictional staging inventory is offline; no fresh endpoint scan or command is demonstrated.
Full narration captions are included in the video. Open video full screen · Download subtitles · Download transcript
Video transcript
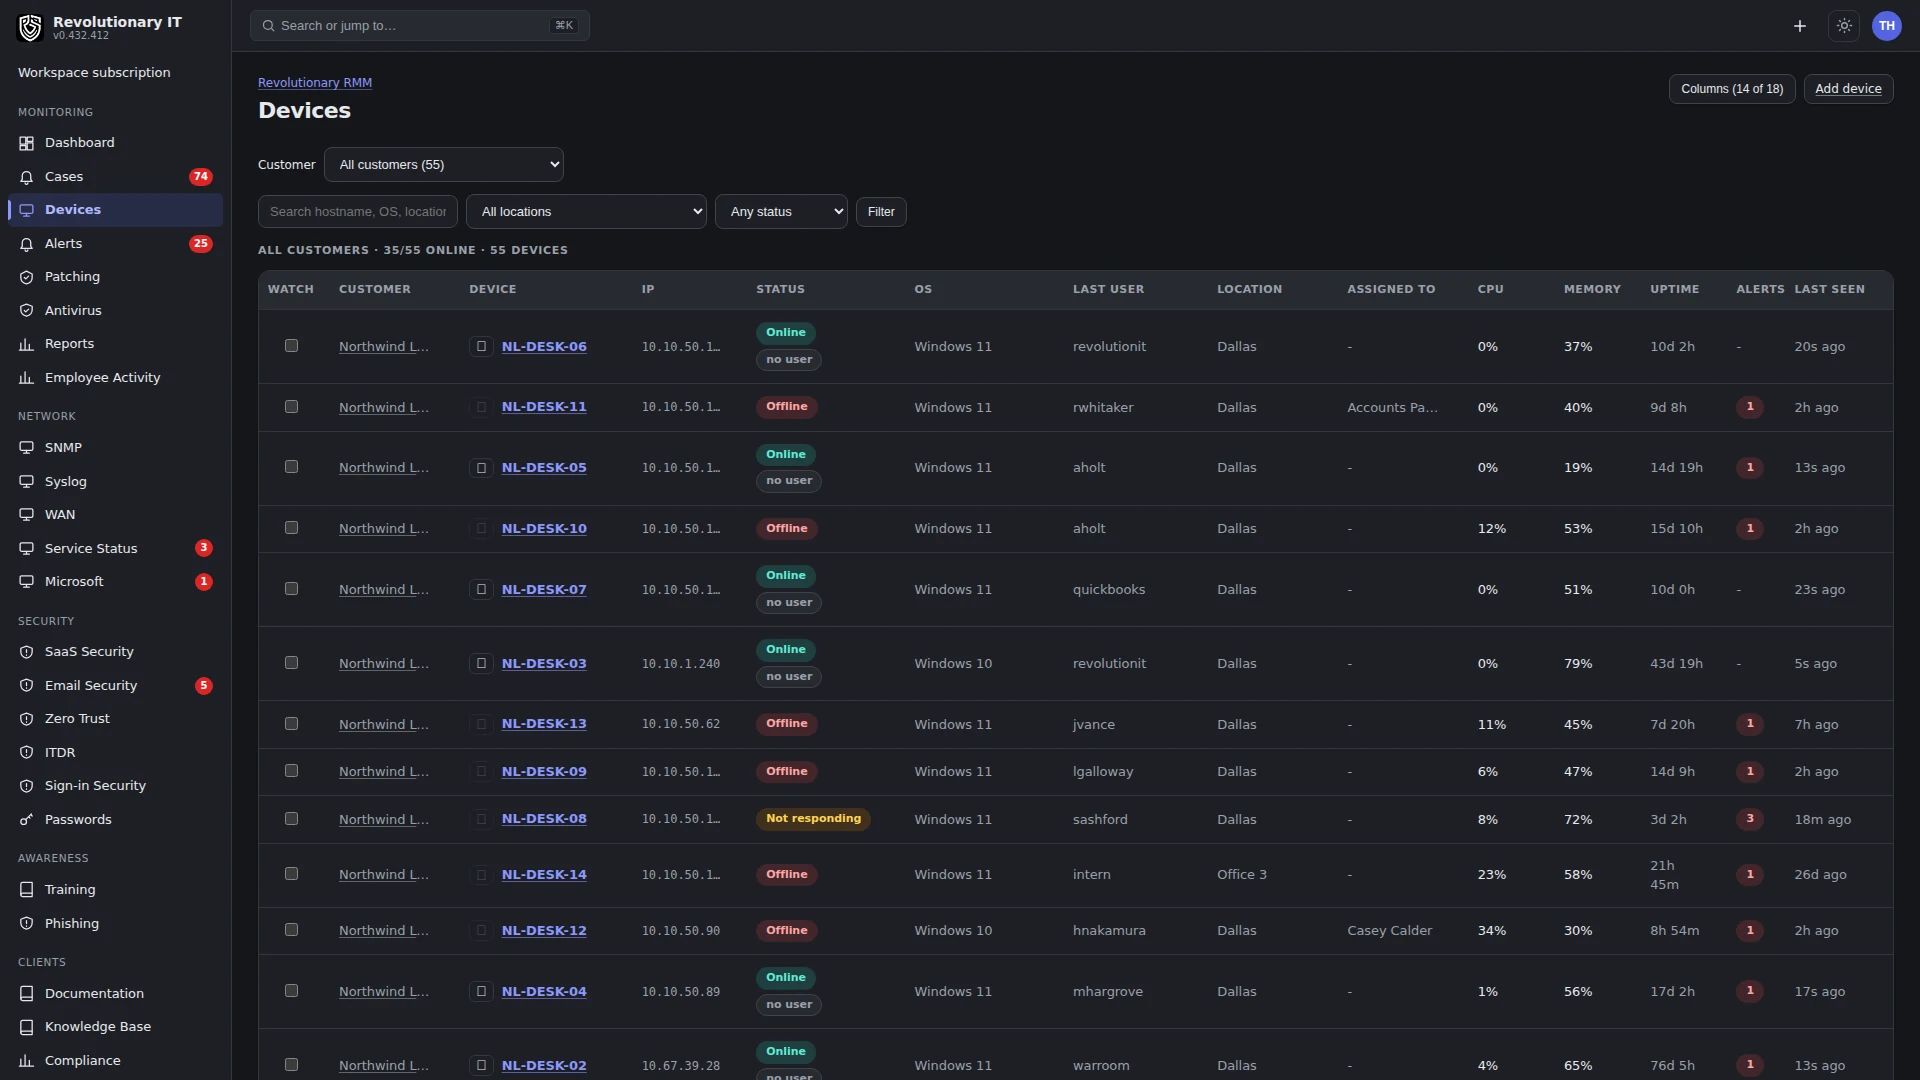
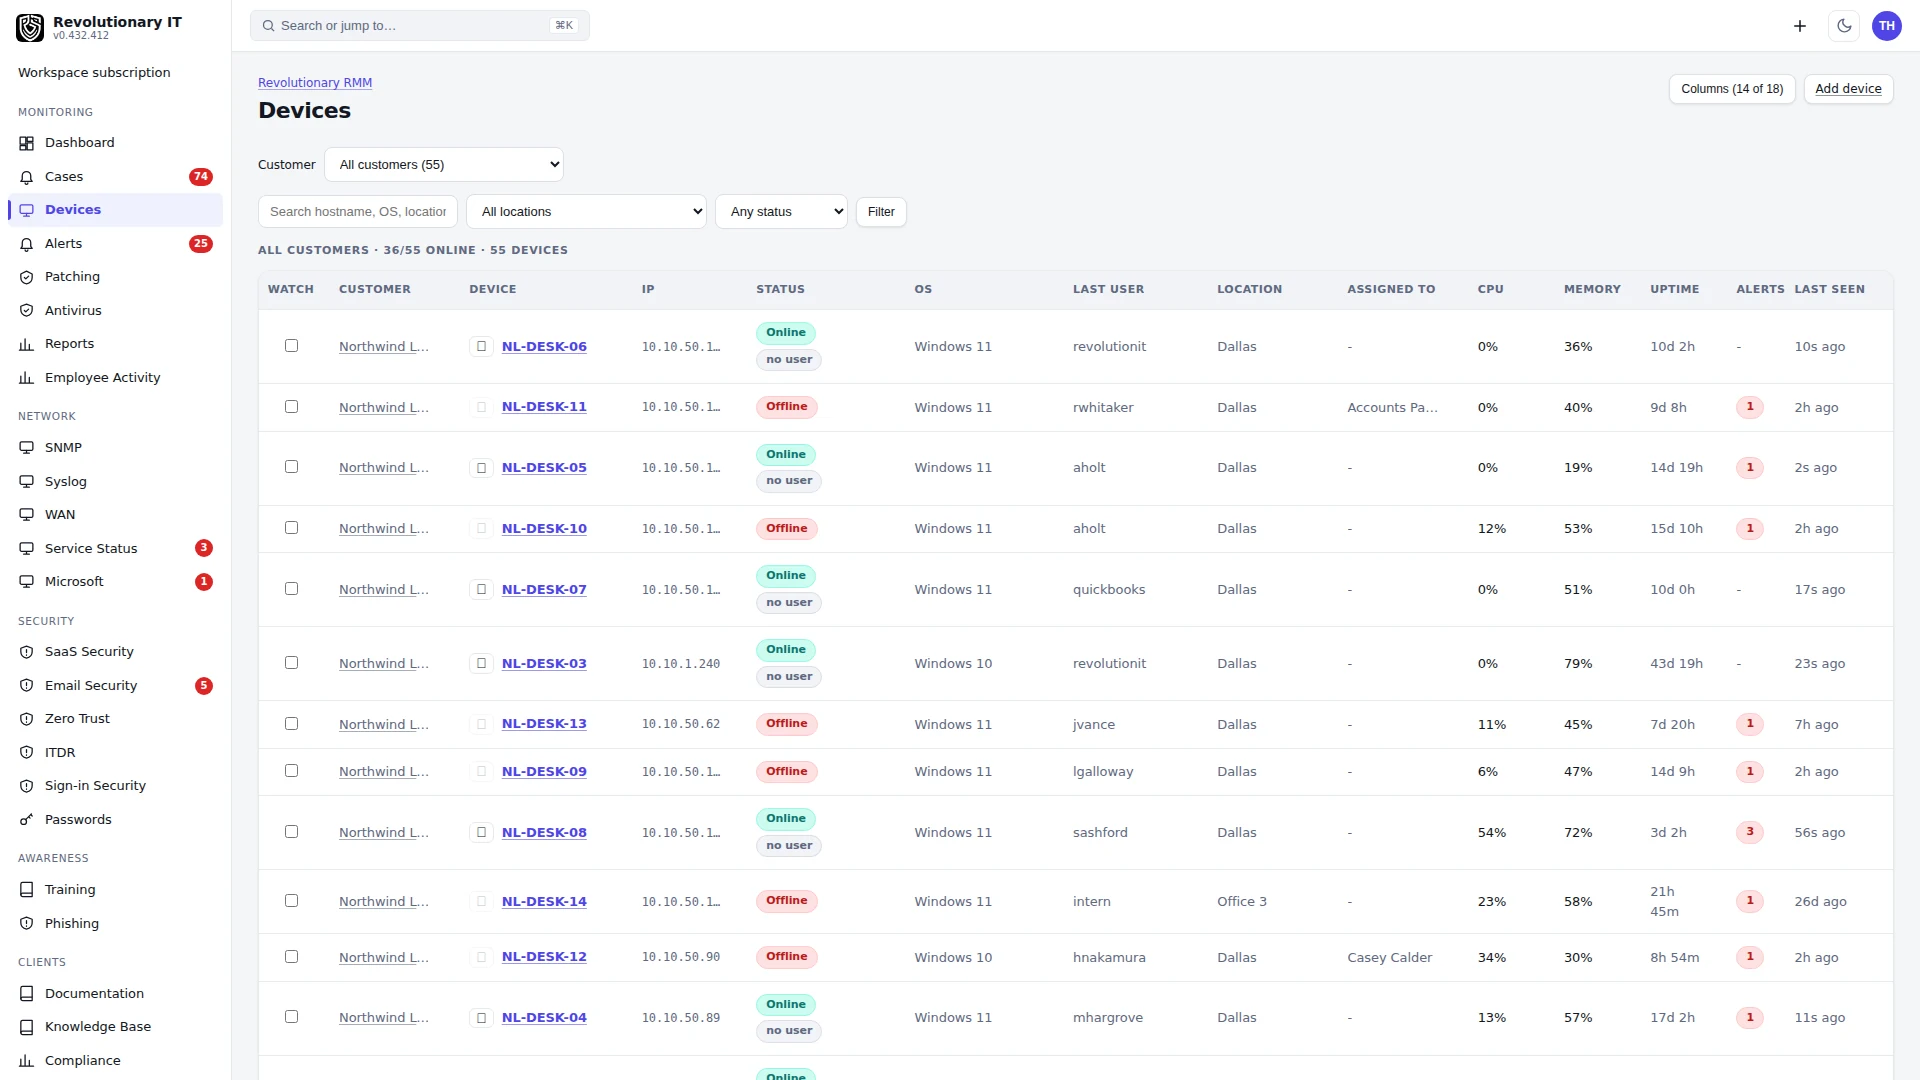
Open Monitoring, Devices. This is the fictional Summit Managed IT workspace. Its fourteen demo devices are offline. The last-seen column is the first check: an old record is not current endpoint health. Use the customer filter before opening a device.
Open Northwind Traders, NWT accounting zero two. Overwatch shows the last reported system information, alerts and performance. Read the timestamp together with each value. This demo record has no performance history, so it cannot establish what the machine is doing now.
Open Software, then Activities. Software is the reported inventory; Activities is where you look for command evidence and reported software changes. A queued job alone does not establish success. After an authorized action on a real test endpoint, check its result and later reporting.
What it does
Monitoring > Devices is the fleet list; each device has a page with everything the platform knows about it and every action a technician can take.
How it works
- Status: Online means a check-in within 3 minutes, Not responding means after 3 minutes through 60 minutes, Offline after 60 minutes. A device with no check-in is shown as Never seen. The same vocabulary is used on the dashboard, the list, the device page and the Take Control button.
- Metrics: the newest snapshot lives on the device's metric row; history is kept per sample for the graphs. Clock skew on a device is clamped at ingest so its events never appear in the future.
- Policy: each check-in evaluates the device against its effective policy (Policies and automations) and opens or clears alerts.
- Activity: the console user, last input time and idle time come from the agent; the Activities tab is the command and software-change history.
The list
Columns: hostname (or display name), organization, location, platform and OS, IP, agent version, status, activity (who is at the console), uptime, CPU, memory, disk, alerts, tags, watch. Filters by organization, location and status, plus a search by hostname, OS, location or user. Tick the watch box on a device to bypass alert-subscription severity floors for it (it is tinted in the list and pilled on its page).
The device page tabs
- Overwatch: status and connectivity, performance graphs (CPU, memory, per-GPU, per-disk, per-adapter network throughput with an adapter selector), storage, system information (make, model, serial, CPU, cores, memory slots, OS build, IP, last shutdown classification), open alerts.
- Patching: pending updates with checkboxes, Install selected, Install all pending, a Reboot button when a reboot is pending, deployment history and the live progress of the detached patch runner.
- Software: the installed-software inventory (searchable), its sample time, the change log of installs and removals, and Install jobs from the automation library. Missing or old sample times mean freshness is unconfirmed. The uninstall queue belongs to the current browser tab; keep it open while queued items are dispatched.
- Tools: remote console, file transfer, process list with live CPU percent, services (start, stop, restart), reboot, the local admin password reveal, and the lost-or-stolen recovery panel (device security guidance from support). Take Control and Refresh (clears every collector cache so the next check-in reports fresh) are buttons in the device header.
- Activities: every command sent to the device with status, exit code and output, plus software events.
- IP history: each address the device reported, with first seen, last seen and whether it is in the latest report. History starts with agent 0.4.51 or later.
- Changes: detected changes to hardware, software, services, security posture and patch state, with old and new values. Patch state is reported when the policy Updates check is on.
- Lifecycle: lifecycle status (In use, In stock, Damaged or On loan) with an optional note and status history, assignment history, and the device's custom field values.
- Vulnerabilities: EDR agents on the device, antivirus health with Enable antivirus, network isolation, BitLocker with recovery-key reveal and Enable BitLocker, the credential-file scan, and account security (failed sign-ins and lockouts with an AI summary).
- Firewall: the host firewall state as the agent reports it.
- Settings: display name, location, assigned user, tags, watch, pinned policy, MSP-held license flag, and delete.
Everything on the device page comes from the agent's own audit: system information and hardware, installed software and software changes, pending patches, services and processes, and security posture. The Changes tab keeps a change history of what was added, removed or altered, with the old and new value and when it was detected, and Monitoring > Devices > Changes shows the same history across a whole customer.
One device page holds the whole picture: system information and hardware, performance history, installed software and changes, pending patches, vulnerabilities, firewall, IP history, activities, lifecycle and the Tools tab, so a technician does not leave the page to understand the device.
Saved filters and custom field columns
Monitoring > Devices keeps your own saved filters. Set the customer, status, location and search you want, give the set a name and save it; it appears after Saved filters at the top of the list and opens with one click. You can keep up to 20, and saving under an existing name replaces that one. A saved filter is tied to your account, so it follows you to any browser, and opening it still shows only the customers you are allowed to see.
The Columns button lists your device custom fields under the standard columns. Tick up to 5 to show them as columns after the others. A cell shows the device value, the field default in italics when the device has no value, or a dash; hovering the dash tells you when a required field is not filled in. Reset returns to the standard set. Deleting a field removes its column for everyone.
Sign-ins, addresses, WSL and blocked drivers
- System information on the device page lists every IPv4 address on an active adapter, not only the main one, and on Windows the WSL distributions registered for signed-in users with their WSL version. If the agent on the device does not report them, the page says so.
- On a Windows device, the Vulnerabilities tab lists the newest successful person sign-ins, up to 20: when, the sign-in type (interactive, unlock, remote desktop or cached), the user, the domain and the account SID.
- The same tab counts App Control block events, including blocks by the vulnerable driver blocklist, both enforced and audit only, with the file names and the time of the latest one.
- Sign-ins and block events are read with the sign-in check. When the check is off in the device policy, or its sample is not current, the tab says that instead of showing an empty list.
Update states and the patch window
The Patching tab shows an Update state line for the device: how many updates are waiting for the user to install, a pending user restart, how many applications or services are waiting for a restart, and partial when the last install applied some updates and not others, with the updates that did not apply. Each state opens to show the update names. When the device reports none of these and nothing is pending, it shows compliant; when the sample is not current it shows update state unknown rather than guessing.
The same line shows the patch window from the device policy: open now, when the next one opens, none set (installs run when scheduled), or none in the next 14 days.
Installer status
Installers lists every installer you generated, one per customer and platform, each with its own enrollment key and expiry date. The Status column reads Active, Active, used, Revoked or Expired, Enrolled shows how many devices used it, and Expires shows the date. Revoked and expired installers stay listed for 30 days so you can still read their status and use count; neither can enroll a device. Below the list, every install attempt is recorded with its result (Enrolled, Token expired, Token revoked, Invalid token or Bad request), so a device that did not appear can be diagnosed.
Step by step: common tasks
Rename a device: Settings tab > Display name. The hostname stays the identity; the display name is what people see.
Assign a device to a location and user: Settings tab. The assigned user is informational; portal access is granted separately in the user's device access list.
Pin a custom policy to one device: Settings tab > Policy. Pinning wins over group, location, client and org-wide layers.
Run a script: Tools tab > Scripts, pick a library script and choose Run on this device. Library scripts are managed under Administration > Library > Scripts.
Query processes and services: Tools tab. Kill is withheld for kernel, security and agent processes.
The Tools tab also lists event logs with events, lets you start, stop or restart a service, and runs a shell or library script as the system account or the logged on user.
Reboot: Tools tab (or the Patching tab when a reboot is pending). Offline devices queue the reboot for up to a week and run it at next check-in.
Refresh: the Refresh button in the device header (also on the Patching tab). Use it after changing something on the machine so inventory, updates, antivirus, BitLocker and the credential-file scan report on the next heartbeat instead of waiting for their cache windows.
Delete a device: Settings tab. Arrange authorized uninstall first. Deletion invalidates that agent identity but does not uninstall it; a reinstall or configuration reset can enroll again under the same customer/short hostname while a token remains valid. Deleting the device removes associated telemetry, commands and software history; a later enrollment does not restore that history. A separate MDM enrollment is not removed by this action.
What deletion removes: a deleted device takes its inventory, telemetry samples, software change history and command history with it. The removal follows the database's own cascade rules rather than a hand-kept list, so a new kind of device record cannot be left behind. The audit log keeps the record of who deleted the device and when (Administration > Audit Log, then Device deletions). A computer that enrolls again later arrives as a new device.
Device groups and tags
Administration > Policies > Device Groups: static or dynamic groups (rules on organization, location, platform, OS, tags and how recently the device was seen). A group can bind a policy, which sits between the location and the pinned layers. Tags are free text on the Settings tab and are usable in group rules.
Hyper-V virtual machines
A Windows server or workstation's device page has a Hyper-V inventory button. Inventory and every virtual machine action run approved library scripts, so the existing script permissions, command switches, signing and audit records apply. Owners and Admins set them up and request actions.
- Choose Add Hyper-V inventory template, then have another administrator approve its version in Scripts. You can also attach the approved script to a scheduled task.
- Choose Refresh Hyper-V inventory and, after the agent checks in, Read latest result. The page lists each virtual machine with its state and checkpoints. Stale inventory is labeled; refresh before relying on it.
- To manage a virtual machine, add each action template (create checkpoint, restore checkpoint, hard restart) and have another administrator approve it in Scripts.
- Under Manage virtual machine, choose Create checkpoint, Restore checkpoint or Hard restart VM. Restore and hard restart require the exact VM name and a data-loss acknowledgment: restoring discards the VM's current state, and a hard restart can lose unsaved data.
An accepted request appears in device activity but does not confirm completion. Read the command history and refresh inventory before another action. A Running state alone does not prove a restart: verify the guest recovered.
Verification
- Enrollment can mark a device seen before it sends telemetry. Confirm a later Last seen time and actual CPU, memory or inventory values; an Online label alone does not prove collection is working.
- After Refresh, check the command result in Activities and look for a later inventory sample. Allow for polling, permissions and collection time.
Troubleshooting
- Enrollment reports hostname_already_enrolled: an existing short hostname in the same client organization is never replaced. Retain saved configuration on reinstall; if it is lost, review the stale record and billing implications before authorized retirement, or use a distinct short hostname.
- Uptime column empty: the agent predates uptime reporting; update the fleet.
- Take Control greyed: the device is offline, not remote capable (capture stub build, no display, Smart App Control), or the user lacks remote permission.
Reimaging or re-enrolling a device with the same hostname does not create a duplicate: the existing record is kept with its history, and the device's identity is never rotated by a second enrollment. The same hostname at a different customer is a different device.